Andrews' experiments
Liquefaction of gases was thoroughly investigated by Thomas Andrews in 1863. He devised apparatus capable of applying measured pressures up to 200 times atmospheric pressure to a gas. Figure 10.18 shows a cross-section of the apparatus.
Two capillary tubes sealed at the upper ends project vertically from a steel casing. The top part of one of the tubes contained the test gas, trapped by a thread of mercury. The top of the other tube contained dry air as a control gas. The mercury in each tube was held in by the water pressure in the casing. The pressure could be increased by turning the screws.
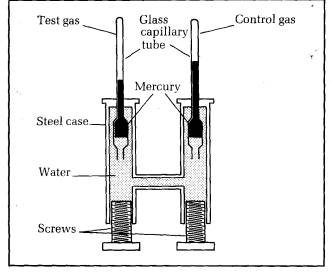
Each tube was in its own water bath, the control bath at room temperature and the test bath at a temperature which could be changed. Both capillary tubes were previously checked for uniform diameter, and the volume of gas per mm length was measured before installing the tubes in the casing.
With the test gas at constant temperature, the pressure was increased in steps. At each step, the length of each gas column was measured when steady. Hence the volume of each gas could be determined. Since the control gas obeys Boyle's law its pressure could be calculated from its volume (using pV= poVo, p and V being the pressure and volume of the control gas at any step, po and Vo being the pressure and volume of the control gas at atmospheric pressure). Because the test gas was at the same pressure as the control gas at each step, then the pressure of the test gas could be found. So Andrews was able to obtain readings of pressure and volume at different constant temperatures for a fixed mass of test gas.
Figure 10.19 shows the results for CO2 as the test gas, with pressure plotted on the vertical axis and volume on the horizontal axis. Each curve is at different constant temperature. The curves are referred to as isotherms of p against V. The state of the CO2 depends on its pressure, volume and temperature. The liquid state can only exist at or below the critical temperature.
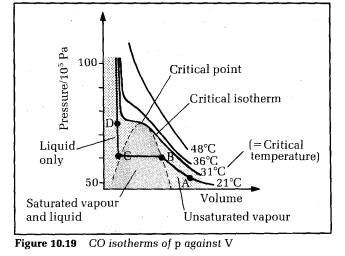
The critical temperature T. is the temperature above which no liquid can form, no matter how great the pressure of the gas is.
The critical isotherm is
the isotherm at the critical temperature. It is flat at one point only.
Isotherms below the critical temperature are flat over a range of volume
corresponding to CO, as saturated vapour and liquid. The point where the
critical isotherm is flat is the highest temperature where liquid is present.
This point is called the critical point.
Consider the isotherm labelled ABCD. At A, the C02 is an unsaturated vapour since no liquid is present. If the volume is now reduced, the pressure rises to point B. At B, the CO2 vapour is just saturated. Further reduction of the volume causes the saturated vapour to liquefy, the percentage of liquid increasing from B to C. The saturated vapour pressure stays constant. At C, the CO2, is entirely liquid. Further reduction of volume is now difficult to achieve because liquids are almost incompressible. So the pressure rises sharply from C to D. All the other isotherms below the critical isotherm are like ABCD in general, each with a liquid‑only section, a saturated vapour and liquid section, and an unsaturated section. Above the critical isotherm, no liquid is present so there are no flat parts on the curves.
Other gases give p against V curves with the same general shape as the C02 isotherms of Figure 10.19, but the critical temperature of each gas differs, and so too does the pressure at the critical point. Andrews' work on the liquefaction of gases led others to design and operate machines capable of liquefying the so‑called permanent gases, nitrogen, oxygen and hydrogen etc. Very low temperatures are achieved when these gases are liquefied. Oxygen, for example, liquefies at 90 K at standard pressure. Its critical temperature is 155 K. Helium‑3 (i.e. 32He atoms) liquefies at 3.2 K at standard pressure. The usual way of supplying oxygen for industrial or medical use is now as liquid oxygen in high pressure cylinders.
Explaining real gas behaviour
For an ideal gas at constant temperature, pV =constant. Real gas behaviour can be compared readily with ideal gas behaviour by plotting isotherms of pV against p. Figure 10.20 shows the 'pV against p' isotherms for air.
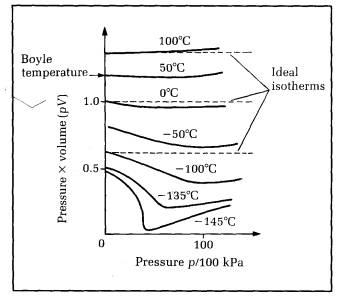
Figure 10.20 pV against p isotherms for air
The graph also shows ideal gas isotherms of pV against p. Since pV is constant for an ideal gas at constant temperature, the ideal isotherms are parallel to the horizontal (p) axis. The real gas isotherms are flat like the ideal isotherms at one particular temperature only, the Boyle temperature Tb. Even at Tb, the isotherm is flat at low pressures only.
a) For temperatures above Tb, the pV curve rises as p is increased.
b) For temperatures less than Tb, the pV curve falls as p is increased from low pressure, then the curve rises with further increase of p. If the temperature is less than T, (the critical temperature) the pV curve drops sharply at constant pressure where liquefaction occurs. Once the ‘gas' is completely liquid, pV rises as p is increased further.
To explain the pattern of the pV against p isotherms, we must look again at the kinetic theory assumptions: in particular, the assumptions that the gas molecules are point molecules with no attractive forces acting between them.
For temperatures above Tb: the molecules become closer when the pressure is increased. So the actual volume of the molecules becomes more important compared with the measured volume of the gas. The available volume in which the molecules can move is less than the measured volume. We can write V - b for the available volume where V is the measured volume; b is a constant, the co‑volume, which represents the actual volume taken by the molecules themselves. So pV rises because the measured volume increasingly over‑estimates the available volume at higher and higher pressures.
For temperatures below Tb: at low temperatures, the molecules move more slowly than they do at higher temperatures. So the weak attractive forces between the molecules have longer to act when molecules approach one another. The weak attractive forces pull on any molecules moving towards the container walls, so reducing the impact. Hence the pressure is reduced compared with the 'ideal gas' pressure. So pV falls compared with the ideal gas value, But as the pressure increases further, the volume of the molecules becomes more and more important. So pV stops falling and starts rising as the pressure is increased more and more.
The pressure reduction is due to attraction between molecules near the container wall and molecules in the bulk of the gas.